In XAS (x-ray absorption spectroscopy), electrons are resonantly excited from an occupied valence electron state to an unoccupied valence electron state [see Fig. 1 (c)]. Each element has a characteristic absorption edge, which allows a specific analysis. For the measurements, however, a photon source is necessary whose energy is tunable. Therefore, the experiment can only take place at a synchroton (e.g., BESSY II in Berlin or ANKA in Karlsruhe).
Figure 1 (c) shows a 2p state and the density of unoccupied states above the Fermi energy E_F. The degeneracy of the 2p1 / 2 and 2p3 / 2 levels, which are occupied by 2 or 4 electrons, is canceled by the spin-orbit coupling. In addition, the densities of unoccupied states (mostly s-, d-states) are shown above EF. The XAS spectrum is a convolution of the density of unoccupied states described above and the occupied 2p density of states [image (a)]. The spectrum shows two characteristic peaks which follow from the junctions of 2p3 / 2 -> 3d (first peak) and 2p1 / 2 -> 3d (second peak). XMCD (x-ray magnetic circular dichroism) describes the dependence of the interaction of matter with right- and left-circularly polarized light (photon vector) relative to the magnetization direction. In the previously described spin-polarized transitions [Figure 1 (c)], the spin polarization of the unstated 3d states lead to a difference in the absorption for right and left circularly polarized light. Since the number of spin-polarized electrons differs for the transitions 2p3 / 2 -> 3d and 2p1 / 2 -> 3d, respectively, and the sign of the spin polarization degree is opposite to right-hand and left-circularly polarized light, two different absorption spectra are to be expected. Figure 1 (b) shows the difference between the two spectra that give the XMCD spectrum.
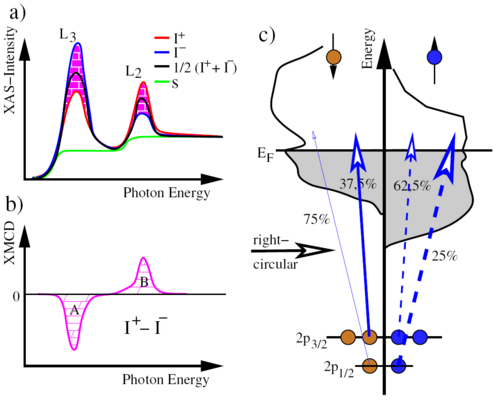
a) XAS spectra b) Difference of the XAS spectra c) Schematic sketch of the excitation